Dynamics 365 Business Central: understanding the Database Wait Statistics page.
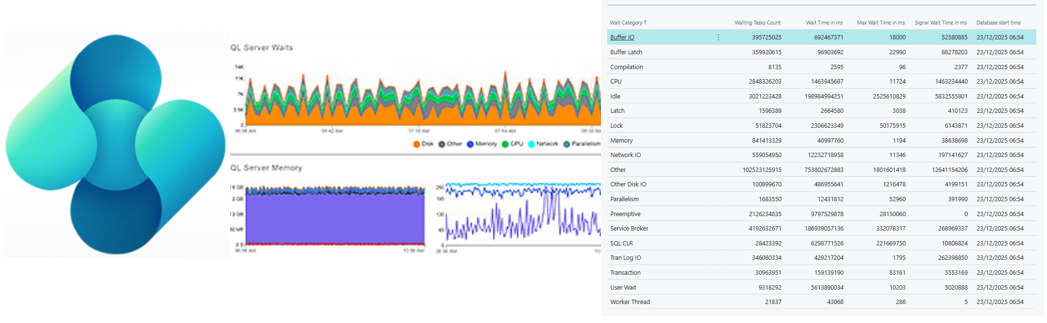
The Database Wait Statistics page in Business Central shows how Azure SQL database time is spent waiting for resources rather than executing queries. Understanding wait categories, task counts, wait times, signal waits, and their ratios helps identify performance bottlenecks like CPU pressure, lock contention, or I/O delays.
 post Stefano Demiliani
Key points
- The Database Wait Statistics page shows data from sys.dm_db_wait_stats for the tenant database. The waits are grouped into categories and add up from the time the database started.
- The page has six columns: Wait Category, Waiting Tasks Count, Wait Time, Max Wait Time, Signal Wait Time and Database start time.
- To get the signal wait ratio, divide signal wait time by wait time. Below 10% is normal and above 20% means significant CPU pressure.
- Rank categories by total wait time rather than count, and divide wait time by count to get the average wait per task.
- To see what the database waited on during a specific period, take snapshots at two points in time and compare them.
AL objects mentioned
As named in the post. A name that matches one object page by exact type and name links to it; the others stay as named.
Context
- Features: Database Wait Statistics page, Wait Category analysis, Signal Wait Time ratio calculation, Lock contention detection, CPU pressure identification, I/O performance monitoring, Average wait per task calculation, Historical wait statistics trending
Source: Stefano Demiliani, community blog. Summary, key points and quotes are derived (CONTENT-NOTICE.md); read the original for the full text.